JAPAN'S AGING CRISIS: NEARLY 30% OF ITS POPULATION IS OVER 65
Japan’s Statistics Bureau put the 65-and-over share at 29.6% in September 2026. What the data mean for work, care and the 2070 projection.
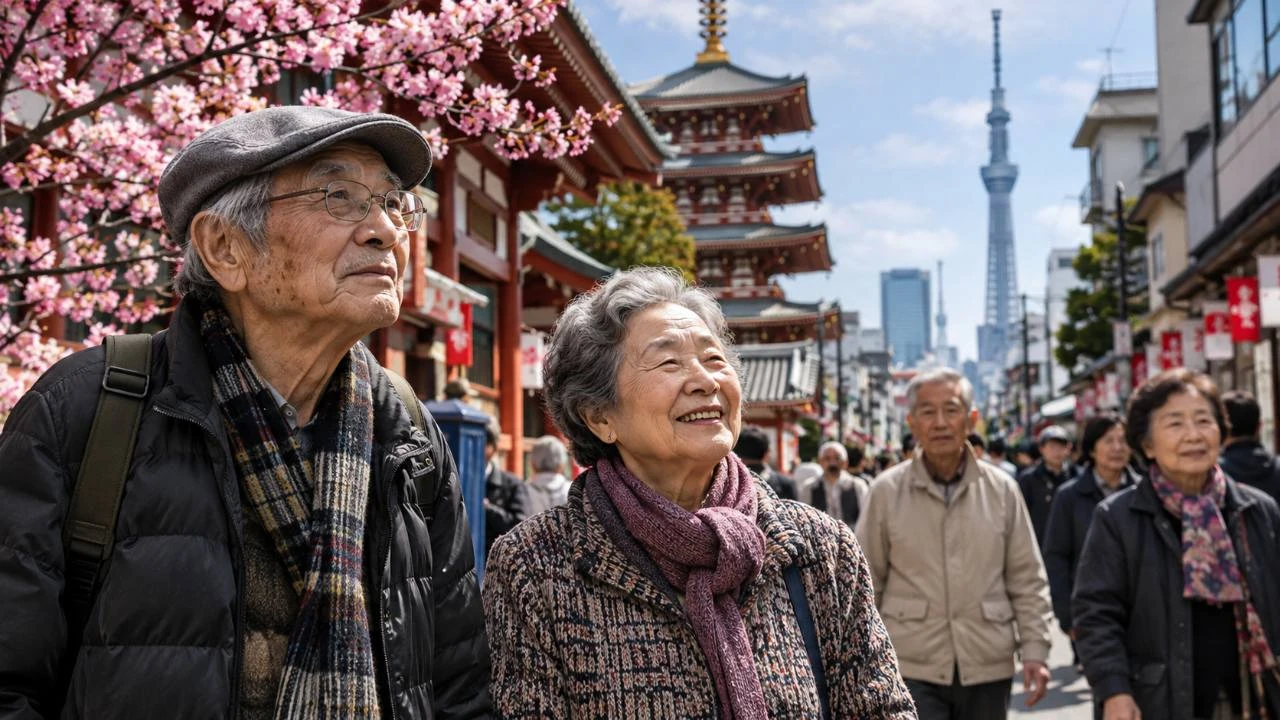
Editorial illustration supplied for PRESDA.
On September 15, 2026, Japan had an estimated 36.24 million people aged 65 or older. They accounted for 29.6% of the country, the highest share in the Statistics Bureau’s annual Respect for the Aged Day release. The age threshold includes people who are exactly 65. The fraction describes the whole population, so it rises when younger age groups shrink even if the older population changes only a little. That arithmetic helps explain why the issue will remain in view even after the number of older people itself turns down. Statistics Bureau of Japan
What nearly 30% means
| Measure | Value | Reference period |
|---|---|---|
| Population aged 65 and over | 36.24 million (29.6%) | September 2026 |
| Workers aged 65 and over | 9.43 million | 2025 |
| Share aged 65 and over, medium projection | 38.7% | 2070 |
Imagine a town of a thousand people with Japan’s national age distribution. Roughly 296 would be 65 or older. That says nothing about how many have stopped working, how many need a carer or whether people have family nearby. Each of those questions requires a separate measure. The same distinction matters when comparing Japan with other countries. The Statistics Bureau reported Japan first among the 39 countries in its comparison. The comparison has a defined membership, so it does not establish a ranking across every country or territory. Statistics Bureau of Japan
The share and the headcount can move differently
The bureau’s September release reports about 20,000 more older residents than in its comparison figure for a year earlier. The share, however, moved from 29.4% to 29.6%. A reader comparing old publications may see different counts for the same reference date because population estimates can be revised. The increase in share is a clearer indication of how the age structure is moving than a small difference in the number of people aged 65-plus. For service planners, both readings matter: proportions show how a local tax base and population are changing, while counts help determine how many appointments or care workers are likely to be needed. Statistics Bureau of Japan
How Japan arrived here
Ageing reflects several things at once. More people survive to later ages, large cohorts move through the age distribution together and smaller cohorts enter behind them. The postwar baby boom created a large group that eventually passed the 65-year line. As that happens, people change age bands without anyone moving into or out of the country. For the whole population to keep its earlier age profile, subsequent cohorts would have to replenish the younger part of the distribution. The Cabinet Office’s ageing white paper tracks the resulting change, which developed over decades. Japan Cabinet Office ageing white paper
What the fertility figure measures
The Ministry of Health, Labour and Welfare reported a total fertility rate of 1.14 for 2025. The measure combines that year’s age-specific birth rates into a hypothetical lifetime number of births. It is useful for comparing years and places, but it is not the number of children an individual family has or a guarantee about the lifetime experience of people now in their twenties. The number of births also depends on how many people are at ages when childbearing is common. Even a rebound in fertility can therefore coexist for some years with a small generation of newborns. Japan Ministry of Health, Labour and Welfare
The timing matters for policy. Changes in childcare or job security may make decisions about having children easier today, but babies born this year will not fill care jobs next year. That delay separates measures that may affect the age structure decades from now from measures that can help employers or families in the meantime.
What an older workforce actually looks like
Japan’s Labour Force Survey figures in the September release put employment among people aged 65 and older at 9.43 million, or 13.8% of all workers, for 2025. It also reports that 76.1% of older employees, excluding executives, were in non-regular employment. The denominator changes between those statements. The first refers to all employed people in Japan. The second refers to a specific group of employees, excluding executives and leaving out the self-employed. Reading them together shows why age alone is a poor substitute for employment status and why the quality and terms of work matter alongside the number of jobs. Statistics Bureau of Japan
Keeping experience without making work a condition of dignity
An older employee may want fewer hours, a predictable schedule or a role that uses years of experience without requiring heavy lifting. Employers can respond by redesigning jobs or investing in tools that reduce the physically demanding part of a shift. That can help retain workers who would like to stay. It can also help younger colleagues doing the same work. The aim of an effective policy is to enlarge the set of choices available, because some people can and want to stay in paid work while others need to step back or care for someone else.
How the change is felt in care and everyday services
A neighbourhood can have a growing need for home visits while losing the drivers, care workers and support staff who make those visits possible. Distance magnifies the problem in places with dispersed settlements. A smaller town may have a modest number of residents who need care, but each visit can still require a long journey. A densely populated district faces a different constraint: one building can contain many people who need services and relatively few accessible apartments or spaces where they can meet.
The Cabinet Office distinguishes the population aged 65 and over from older age categories including people 75 and older. This matters because a single broad category conceals differences in health, work and household arrangements. For example, a service designed for an active person in their late sixties may do little for someone in their eighties who cannot reach a clinic. A local plan has to turn demographic counts into practical questions about housing, transport, respite for family caregivers and the availability of care staff. Japan Cabinet Office ageing white paper
How to read the 2070 projection
Japan’s National Institute of Population and Social Security Research projected 87 million residents and a 38.7% share aged 65 and over by 2070 in its 2023 medium-fertility and medium-mortality scenario. That model begins with the 2020 census and applies assumptions about births, deaths and migration. A change in those assumptions shifts the outcome. Notably, the same scenario has fewer people aged 65 and above in 2070 than the 2026 estimate, even though their share is higher. The projected population as a whole is considerably smaller. That is why the reported percentage can climb without an older cohort expanding forever. National Institute of Population and Social Security Research
What matters now is how governments and employers adjust services and working conditions while people are already living through the transition. A useful way to separate the questions is to compare the current age profile, the labour market figures and the long-range scenarios side by side. One tells us who lives in Japan now, one tells us who is working and one tests what might happen under specified assumptions. For a different question about growing older, see PRESDA’s guide to the science of human ageing.
Why care needs cannot be read straight from the age chart
The age profile helps estimate demand across a region, but two places with the same percentage can have very different needs. The number of people living alone, the distance to a hospital and the supply of accessible apartments all affect how much help can be arranged in practice. Local authorities can track travel time for a home visit and the length of a waiting list alongside demographic statistics. These measures make it possible to see whether a service is keeping up with the people who need it, even when a national percentage barely changes.
FAQ
Frequently Asked Questions
What share of Japan is 65 or older?
The Statistics Bureau estimated 29.6%, or 36.24 million people, on September 15, 2026.
Are all people aged 65 or older retired?
No. The bureau reported 9.43 million employed people aged 65 or older for 2025.
Is the 2070 figure a prediction?
It is a scenario based on assumptions about fertility, mortality and migration.
PRESDA Dispatch
Stay Informed. Stay Aware.
A sharp briefing across AI, gaming, sport, business, world affairs, paparazzi, and lifestyle.