The Wow! Signal: 72 seconds that baffled astronomers
In 1977 Ohio’s Big Ear detected a narrowband signal near the hydrogen line. The printout recorded six intensities and left the source unresolved.
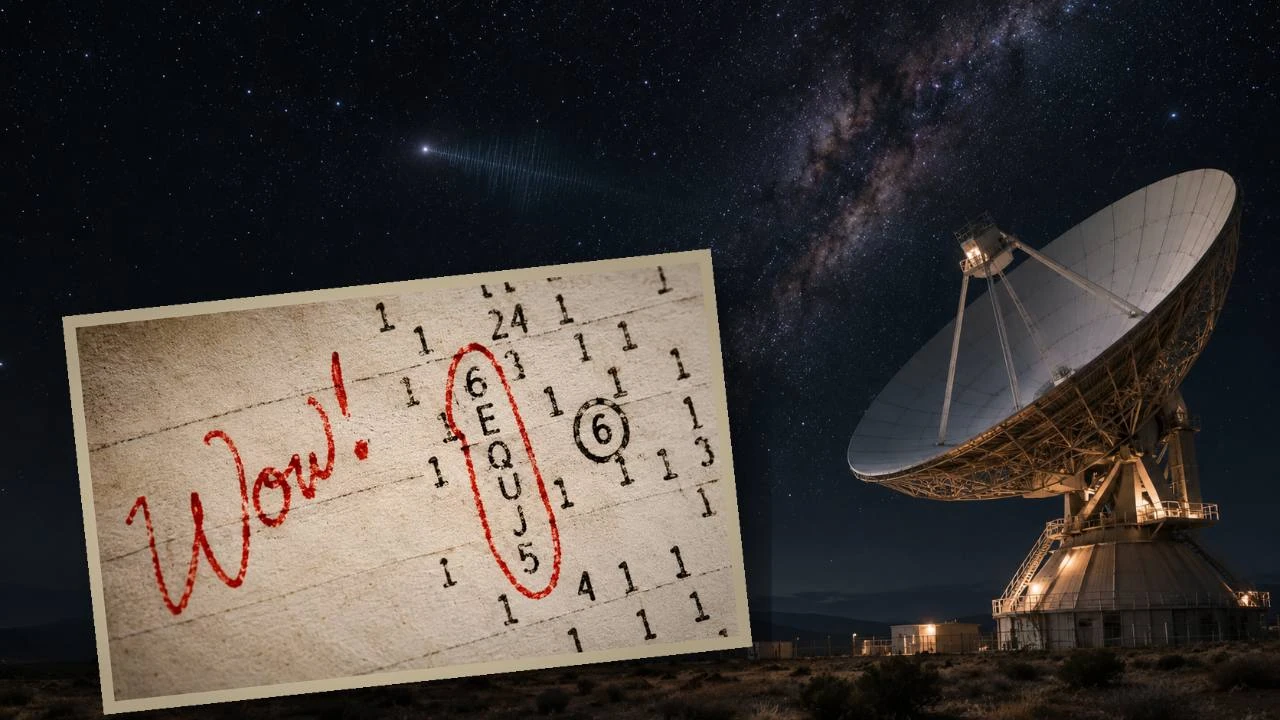
Editorial illustration with a recreated printout and a generic radio dish.
On August 15, 1977, Ohio State University’s Big Ear telescope recorded unusual radio energy in a narrow frequency channel from the direction of Sagittarius. Reviewing the printout later, volunteer astronomer Jerry Ehman circled 6EQUJ5 and wrote Wow! beside it. His note gave the event a name. The instrument had logged a rise in signal strength followed by a fall. Jerry Ehman’s Big Ear report
Read the record from top to bottom
On the paper, a column corresponds to a receiver channel and successive lines show successive samples. The striking sequence appears vertically in one channel. Read down it: the intensity rises through 6, E and Q, peaks at U, then falls through J and 5. Letters extend the scale once a digit no longer suffices. The mark in red belongs to Jerry Ehman’s later review of the output. His annotation became the name of the event, while the printed column remains the measurement astronomers can actually analyze. Compare the stronger readings to the scattered low values in neighboring columns. Big Ear
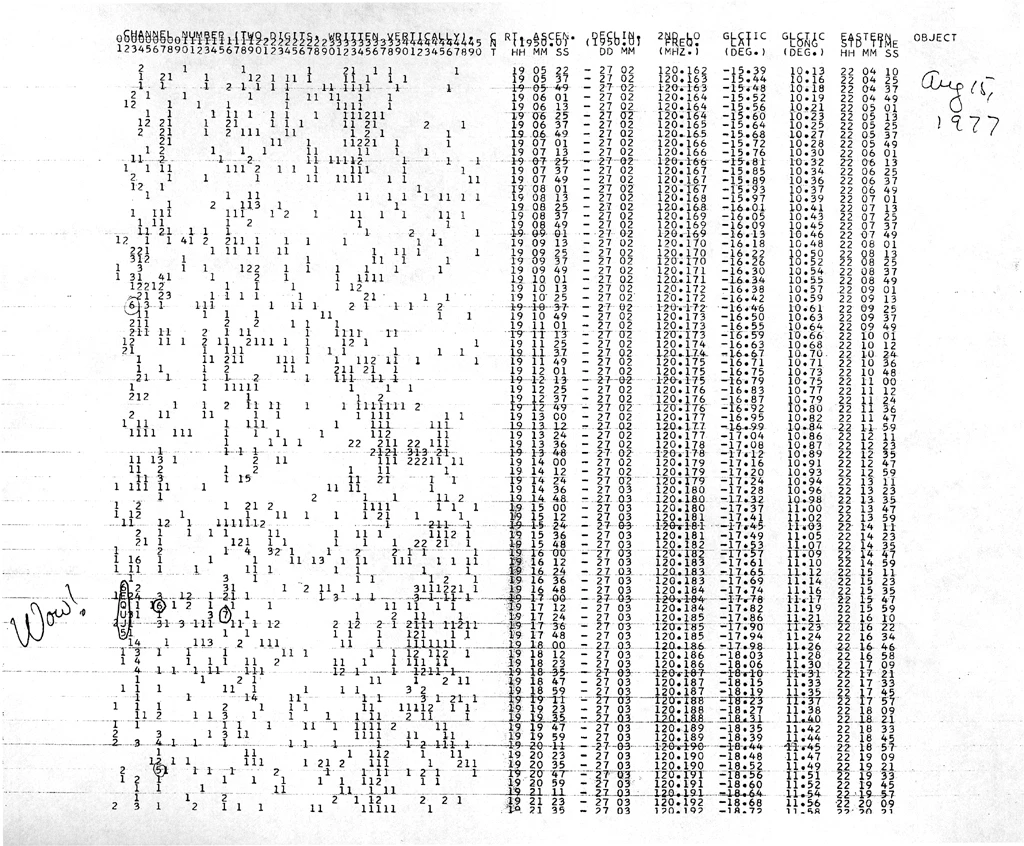
Scan of a copy of Big Ear’s August 15, 1977 computer printout. The six circled readings run down one receiver channel.
Big Ear Radio Observatory and North American AstroPhysical Observatory. Public domain.
Archival record and reuse informationWhy a 12-second sample hides detail
An intensity reading condenses what happened over its sampling interval. The six symbols therefore cannot tell us whether the strength varied rapidly within any one interval. Big Ear’s output also did not retain a waveform from which to recover a voice, pulse pattern or other fine structure. A modern telescope can preserve richer measurements if it is configured to capture them, but a later analysis cannot recover information the 1977 recording did not store. Big Ear
What 72 seconds means
The 72 seconds describe Big Ear’s observing window in this detection. They do not establish the full lifetime of the source. Only one of the instrument’s two feeds saw the event, leaving two candidate areas on the sky and no second trace to fix the location. Jerry Ehman’s Big Ear report
Why hydrogen made the frequency interesting
Neutral hydrogen produces a familiar emission line near 1420.4 MHz. Because hydrogen is widespread, astronomers can measure that line in many parts of the Milky Way. A search for technology can also use this region of the spectrum as an obvious place to listen. The technical resemblance goes only so far. A narrow bandwidth tells us that the recorded energy occupied a limited slice of the radio spectrum. It does not tell us whether a transmitter, a natural process or interference produced it. The Arecibo project’s estimate of 1420.726 MHz comes from a reanalysis, so its extra precision should be read with the project’s stated caveats. Big Ear UPR Arecibo
Hydrogen, interference and a possible beacon
Recent analysis of archival Ohio SETI data places the frequency near 1420.726 MHz, close to neutral hydrogen’s 21-centimetre line. Such a narrow signal attracted SETI interest, but a protected frequency and a plausible beam shape do not identify an emitter. Terrestrial interference is difficult to reconstruct decades later and no candidate transmitter has been confirmed. Arecibo Wow! project data
An Arecibo research team proposed that a transient flare could briefly brighten emission from cold interstellar hydrogen. Its archival comparison provides a possible natural mechanism. It has not identified the actual cloud or flash behind the 1977 event. Arecibo Wow! hydrogen hypothesis
What changed when the archive was reanalyzed
The Arecibo team revisited old Ohio SETI material and reported revised sky coordinates and a peak flux density above 300 janskys. Flux density measures received radio power per unit area and bandwidth. It is distinct from the number represented by U, which describes signal strength relative to the instrument’s noise. A brighter estimate changes how investigators interpret earlier searches, but their ability to detect a repeat still depends on where they pointed, what frequency they monitored and how long they stayed there. UPR Arecibo Gray and Ellingsen
What would resolve the mystery?
Follow-up searches have yielded no confirmed repeat. A model can show that an intermittent emitter might evade detection, but that result depends on assumptions about its behavior. A new observation with independent instruments, precise localization and spectral detail would help distinguish interference, an astrophysical event and a technological source. MNRAS follow-up analysis
Why Big Ear left two places to search
Big Ear used two receiver horns. As Earth rotated, a steady source typically crossed both beams in succession. The Wow! event appeared in just one, and the printout did not identify which horn received it. That left two candidate positions in Sagittarius. The rise and fall looked like a source crossing the beam, but the missing second detection left an equally important question: was the signal still present when the other beam passed? Source · bigear.org
What later telescopes could rule out
What a second detection would need to establish
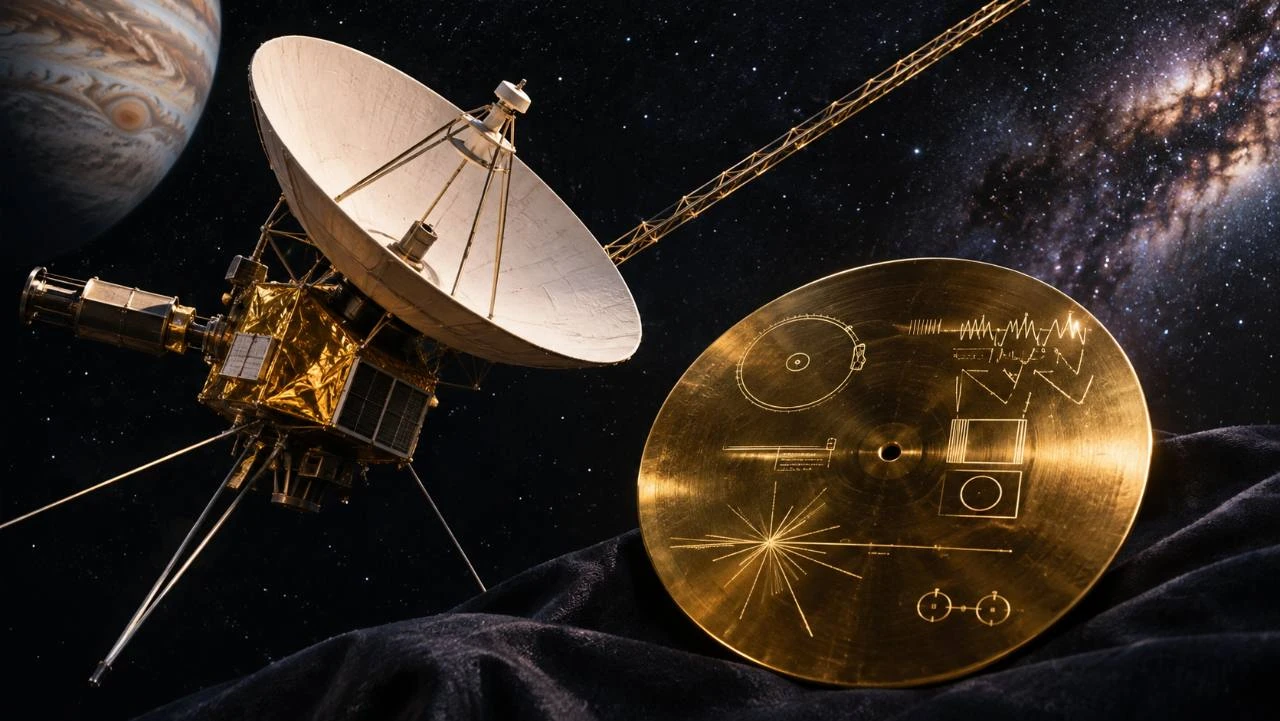
Repeatability alone would be a start. Two observatories could check whether the same signal arrived at the time and from the sky position expected for an astronomical source. High-resolution measurements could test whether the frequency shifted in a way consistent with relative motion. Researchers would still need to check local and satellite interference. Contrast the 1977 case with Voyager’s Golden Record, whose designers, message and physical medium are documented. No equivalent identifying evidence exists for the Wow! signal. UPR Arecibo Gray and Ellingsen
Robert Gray and Kevin Marvel used the Very Large Array to look for a faint, persistent source in the candidate area. They found no convincing counterpart. Gray and Simon Ellingsen then observed from Tasmania for nearly 14 continuous hours on multiple days. Their null result constrains regularly repeating signals bright enough for that instrument and within its observing band. A weaker, rarer or nonperiodic event could still evade those observations. The two searches tested different ideas, so their failures narrow the possibilities without identifying what Big Ear saw. Source · doi.org Source · bigear.org
FAQ
Frequently Asked Questions
Was 6EQUJ5 a message?
It was Big Ear’s record of six successive intensity readings.
Has the signal been explained?
Several hypotheses exist. No source or repeat detection has been confirmed.
PRESDA Dispatch
Stay Informed. Stay Aware.
A sharp briefing across AI, gaming, sport, business, world affairs, paparazzi, and lifestyle.